This example uses daft-physical-ai, a Daft extension for physical AI data pipelines. It scores robot episodes with a reward model (Robometer-4B) as a Daft pipeline: per-frame task progress (0-1) plus success probability, written back as a dataset column with score_rewards. Downstream uses: filter failed or stalled episodes before BC training, dense reward for RL post-training, and catching mislabeled tasks (all-zero progress usually means the task text is wrong).
Scoring is a pure HTTP call - you bring a running Robometer eval server (run_robometer_server.py on any NVIDIA GPU, or modal deploy modal_eval_server.py; both can be found in the daft-physical-ai repo) and point ROBOMETER_URL at it.
Setup
Install with pip install daft-physical-ai matplotlib, then import.
| from daft import col
from daft.datasets import lerobot
from daft_physical_ai.rewards import score_rewards
|
The dataset, which camera's video to decode, how many episodes to score, and how many frames to sample per episode.
| DATASET = "nvidia/LIBERO_LeRobot_v3"
SPLIT = "libero_90"
VIDEO_KEY = "observation.images.image" # camera whose video the episodes index into
EPISODES = 5
MAX_FRAMES = 8 # frames sampled per episode (first + last always included)
|
Point at your Robometer server
The pipeline takes a URL and doesn't care what's behind it - a local GPU (run_robometer_server.py), Modal (modal_eval_server.py), or anything else that serves the eval server's /evaluate_batch_npy.
1
2
3
4
5
6
7
8
9
10
11
12 | import os
# Any running Robometer eval server works here - the pipeline only sees a URL.
# local GPU: python run_robometer_server.py (then http://localhost:8001)
# Modal: modal deploy modal_eval_server.py (prints the https URL)
ROBOMETER_URL = os.environ["ROBOMETER_URL"]
# Modal proxy-auth deployments need these two headers; a local server needs none.
HEADERS = (
{"Modal-Key": os.environ["MODAL_KEY"], "Modal-Secret": os.environ["MODAL_SECRET"]}
if os.environ.get("MODAL_KEY")
else None
)
|
Build the episode DataFrame
One row per episode, straight from Daft's LeRobot reader: read_episodes reads the episode metadata and resolves which shared mp4 holds each episode's footage; include_video_metadata=True keeps where in that file the episode lives (from_timestamp/to_timestamp). Everything streams from the Hub - nothing to download first.
1
2
3
4
5
6
7
8
9
10
11
12
13 | df = (
lerobot.read_episodes(f"hf://datasets/{DATASET}/{SPLIT}", include_video_metadata=True)
.sort("episode_index")
.limit(EPISODES)
.select(
"episode_index",
col("tasks").list_join("; ").alias("task"),
"length",
col(f"videos/{VIDEO_KEY}/from_timestamp").alias("from_ts"),
col(f"videos/{VIDEO_KEY}/to_timestamp").alias("to_ts"),
col(f"videos/{VIDEO_KEY}/video").alias("video"),
)
)
|
Score the episodes
score_rewards returns a reward column: it samples MAX_FRAMES frames per episode, decodes them from the episode's segment of the video (streamed through the file handle), and asks the server for per-frame progress + success. It's a lazy async Daft UDF, so nothing runs until we materialize below - and episodes score concurrently when they do.
| df = df.with_column(
"rewards",
score_rewards(
df["task"], df["length"], df["from_ts"], df["to_ts"], df["video"],
url=ROBOMETER_URL, max_frames=MAX_FRAMES, headers=HEADERS,
),
)
|
Read the curves
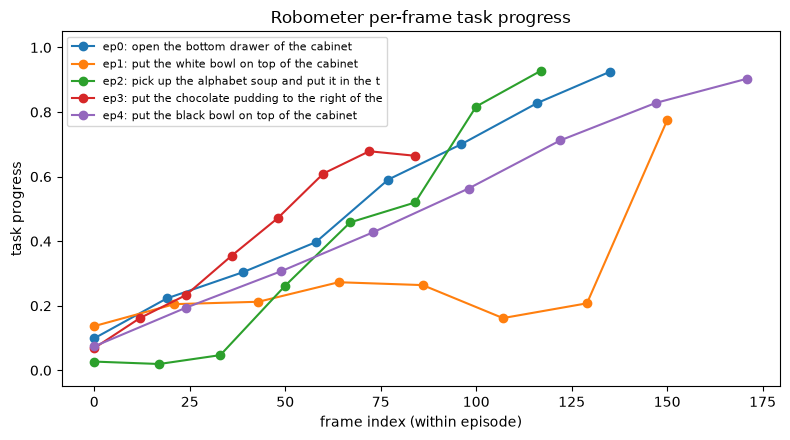
A healthy episode climbs toward 1.0. A curve that flatlines near 0 is a failed or stalled episode - or a mislabeled task - that you almost trained on.
| episodes = df.to_pylist()
for e in episodes:
r = e["rewards"]
print(f"ep{e['episode_index']} ({e['task']}):")
print(f" progress = {[round(p, 2) for p in r['reward_score']]}")
print(f" success = {r['robometer_success'][-1]:.2f} (final frame)")
|
 1
 2
 3
 4
 5
 6
 7
 8
 9
10
11
12
13
14
15 | ep0 (open the bottom drawer of the cabinet):
progress = [0.1, 0.22, 0.3, 0.4, 0.59, 0.7, 0.83, 0.92]
success = 0.97 (final frame)
ep1 (put the white bowl on top of the cabinet):
progress = [0.14, 0.21, 0.21, 0.27, 0.26, 0.16, 0.21, 0.77]
success = 0.49 (final frame)
ep2 (pick up the alphabet soup and put it in the tray):
progress = [0.03, 0.02, 0.05, 0.26, 0.46, 0.52, 0.82, 0.93]
success = 0.93 (final frame)
ep3 (put the chocolate pudding to the right of the plate):
progress = [0.07, 0.16, 0.23, 0.36, 0.47, 0.61, 0.68, 0.66]
success = 0.16 (final frame)
ep4 (put the black bowl on top of the cabinet):
progress = [0.07, 0.19, 0.31, 0.43, 0.56, 0.71, 0.83, 0.9]
success = 0.88 (final frame)
|
Plot the progress curves
Needs matplotlib.
 1
 2
 3
 4
 5
 6
 7
 8
 9
10
11
12
13
14 | import matplotlib.pyplot as plt
fig, ax = plt.subplots(figsize=(8, 4.5))
for e in episodes:
r = e["rewards"]
xs = [f["index"] for f in r["reward_frames"]]
ax.plot(xs, r["reward_score"], marker="o", label=f"ep{e['episode_index']}: {e['task'][:45]}")
ax.set_xlabel("frame index (within episode)")
ax.set_ylabel("task progress")
ax.set_ylim(-0.05, 1.05)
ax.set_title("Robometer per-frame task progress")
ax.legend(fontsize=8, loc="upper left")
plt.tight_layout()
plt.show()
|
Filter with a Daft query
The scores are ordinary columns, so quality gates are one-liners - here, episodes whose final-frame success probability is below 0.5.
| from daft import col
# episodes the model doubts succeeded - review these before training on them
flagged = df.where(col("rewards")["robometer_success"][-1] < 0.5)
flagged.select("episode_index", "task").show()
|
| episode_index | task |
| 1 | put the white bowl on top of the cabinet |
| 3 | put the chocolate pudding to the right of the plate |